


TermFrequencyWidget
A widget to control and visualize a TermFrequency object.
The widget control is based on the JTable.org plugin and requires the following CSS (scripts are included in the minified version of the API):
<!-- JTable CSS -->
                        <link href="http://www.jtable.org/Content/highlight.css" rel="stylesheet" type="text/css" />
                        <link href="http://www.jtable.org/Scripts/jtable/themes/jqueryui/jtable_jqueryui.css" rel="stylesheet" type="text/css" />

                        <!-- API CSS -->
                        <link href="https://api.geodab.eu/docs/assets/css/giapi.css" rel="stylesheet" type="text/css" />
The graphics are created using Charts.js library and the scripts are included in the minified version of the API.
Control widget
The control widget is composed by one or more table depending on the
targets of the provided
TermFrequency object;
there is a table for each term frequency target.
The image below shows a widget of a TermFrequency object having
3 term frequency targets: "keyword","format" and "protocol".
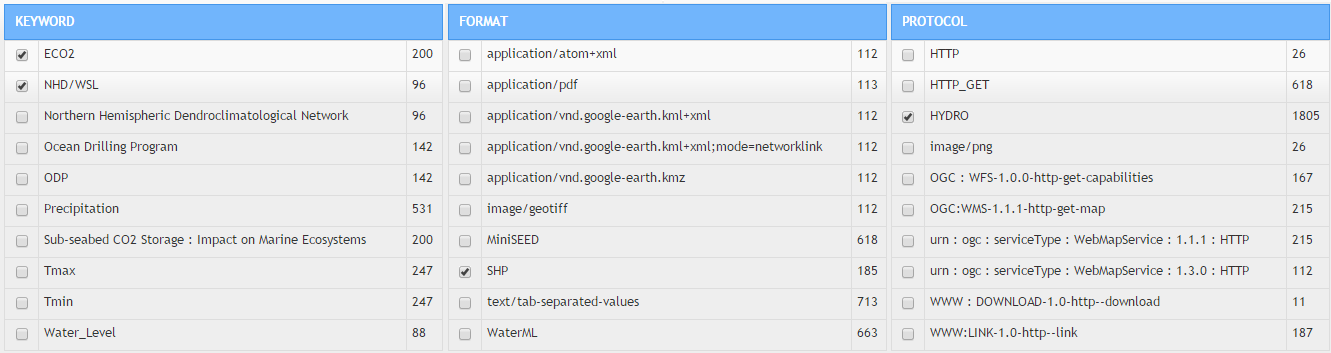
The table caption corresponds to the related term frequency target.
Each table has a checkbox for
each term frequency item;
the term is in the middle and the
frequency on the right.
When the checkbox of a term frequency item
is checked, the
refine method is called including all the
checked items.
Visualization widget
The optional visualization widget is composed by one or more Bar Chart depending on the
targets of the provided
TermFrequency object; as for the control widget,
there is a bar chart for each term frequency target.
The charts are inserted in a JQuery UI Tabs, with a tab for each chart as depicted in the image below.
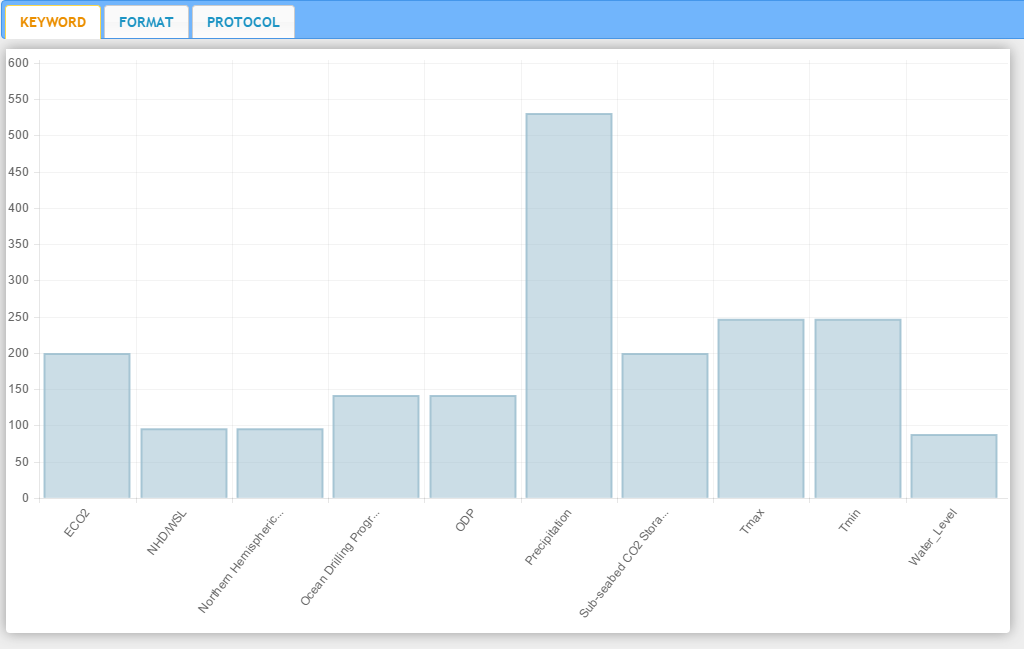
Each chart has a bar for
each term frequency item;
the terms are the label on the x axis, while the
frequency are the values on the y axis.
Click on a bar is equivalent to the selection with the control widget; when the bar of a term frequency item
is clicked, the
refine method is called including all the
checked items.
The visualization widget can be enabled and initialized with the chart method
before the calling of the init method
                         // something to do before the discover is refined
                         var beforeRefine = function(){
                         ...
                         };

                         // something to do after the discover has been refined
                         var afterRefine = function(){
                         ...
                         };

                         // creates the widget with the default options
                         var freqWidget = GIAPI.TermFrequencyWidget(id, beforeRefine, afterRefine,{
                            'headerBckColor': '#2C3E50',
                            'headerBorder': '1px solid #2C3E50',
                            'headerLabelColor': '#fff',
                            'headerLabelWeight':'bold',
                            'headerLabelFontFamily':'Helvetica Neue, Helvetica, Arial, sans-serif',

                            'itemLineColor': '#ddd',
                            'itemLabelColor': 'black',
                            'itemLabelWeight': 'normal',
                            'itemLabelFontFamily': 'Helvetica Neue, Helvetica, Arial, sans-serif'
                         });

                         // enables the visualization control with the default options and styles
                         freqWidget.chart('chart');

                         // ...

                         var onDiscoverResponse = function(response) {
                            var resultSet = response[0];
                            ...
                            // updates the widget with the current result set
                            freqWidget.update(resultSet);
                            ...
                         }
Constructor
TermFrequencyWidget
-
id -
beforeRefine -
afterRefine -
[options]
Parameters:
-
idStringid of an existent HTML container (typically
<div>element) in which the control widget is inserted -
beforeRefineFunctiona function called when a checkbox or a bar is clicked, before the refine method is called
-
afterRefineFunctiona function called when a checkbox or a bar is clicked, after the refine method is called
-
[options]Object optional-
[divCSS='width: 350px;display: inline-block;margin-left: 5px;margin-bottom: 5px;']String optionalCSS of the <div> which contains the widget tables
-
[headerBckColor='#2C3E50']String optional -
[headerBorder='1px solid #2C3E50']String optional -
[headerLabelColor='white']String optional -
[headerLabelWeight='bold']String optional -
[headerLabelFontFamily='Helvetica Neue, Helvetica, Arial, sans-serif']String optional -
[itemBckColor]String optional -
[itemLineColor='#ddd']String optional -
[itemLabelFontSize='100%']String optional -
[itemLabelColor='black']String optional -
[itemLabelWeight='normal']String optional -
[itemLabelFontFamily='Helvetica Neue, Helvetica, Arial, sans-serif;']String optional
-
Methods
chart
-
chartElementId -
[options] -
[styles]
Enables and initializes the visualization control
Parameters:
-
chartElementIdStringid id of the HTML container (tipically
<div>element) where the charts tab is inserted -
[options]Object optionalthe charts options. See chart options and specific bar chart options for more info
-
[styles]Object optionalan object with a style property for each chart. The style defines the aspect of the chart, as described here. This API defines some extra properties; see the following code snippet which sows the default values for each property.
var styles = {};

                                            // style for the "format" chart
                                            styles.format = {

                                                    // --- extra properties for the canvas where the chart is drawn ---

                                                    canvasStyle: "background: white; margin: 5px; margin-top: 10px; box-shadow: 0 0 20px #999;",
                                                    canvasWidth: 1000,
                                                    canvasHeight: 580,

                                                    // --- extra properties for the checked bars ---

                                                    checkedFillColor: "#BBDAF7",
                                                    checkedStrokeColor: "#378DE5",
                                                    checkedHighlightFill: "rgba(55, 141, 229, 0.59)",
                                                    checkedHighlightStroke: "#377DE5",

                                                    // --- default bar chart properties ---

                                                    fillColor: "rgba(151,187,205,0.5)",
                                                    strokeColor: "rgba(151,187,205,0.8)",
                                                    highlightFill: "rgba(151,187,205,0.75)",
                                                    highlightStroke: "rgba(151,187,205,1)"
                                            };

                                            // style for the "source" chart
                                            styles.source =...

                                            // style for the "keyword" chart
                                            styles.keyword = ...

                                            // style for the "protocol" chart
                                            styles.protocol = ...
update
-
resultSet
Updates the widget with the term frequency object of the current result set
Parameters:
-
resultSetResultSet